Attribute Association Graph Navigation in Neo4J Bloom
If you not yet configured Neo4J Bloom, check out here
If you used Neo4J Bloom before, you will most likely be familiar with most of the functionalities described here. Notice that Neo4J Bloom was developed independently of GraphXplore, and we only configured it to our needs. You don’t need coding or scripting skills to operate Neo4J Bloom, your only interactions are via mouse-clicking and search bar prompts. Checkout a quick start introduction by Neo4J the developers themselves. If you are an advanced user and want to query the graph databases yourself, check out a visual tour of Neo4J Browser. However, the rest of this guide will focus on Neo4J Bloom.
Table of contents
Search Bar
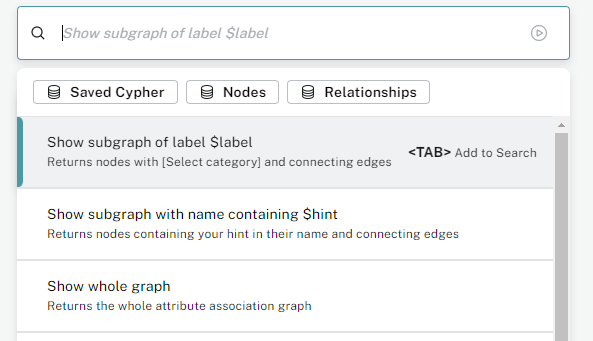
When you start your exploration, the main instrument will often be the search bar in the upper left corner. Here, you can display the whole graph or parts of it in three different ways:
- Type or click on “Show whole graph” to display the whole AAG. You can dismiss parts of the graph from the visualization later on
- Type or click on “Show subgraph of label “ followed by a table or variable label assigned during metadata annotation. All available labels will be displayed for auto-completion. Press
Tabto finish the statement. All attribute nodes with this label and their connecting edges will be added to the visualization - Type or click on “Show subgraph with name containing “ followed by a string. Press
Tabto finish the statement. All attribute nodes with the string contained in their variable name together with their connecting edges will be added to the visualization

Interacting with Nodes
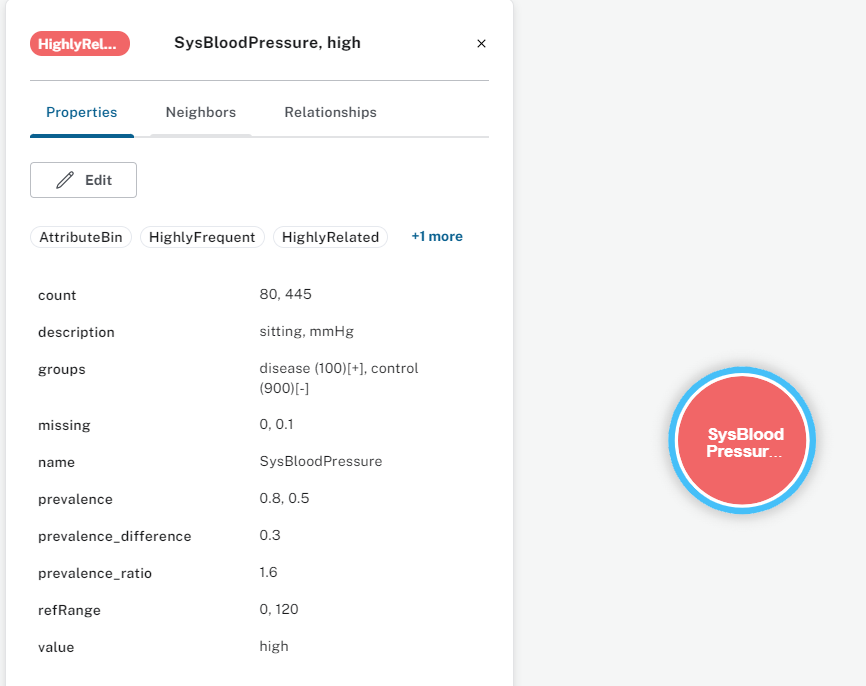
Nodes are depicted as colored circles with the variable name of the attribute displayed in bold and followed by the variable value. You can select nodes by clicking on them. If you want to select multiple nodes, you do so with pressing Ctrl while left-clicking. You can dismiss one or multiple nodes from the visualization by right-click and “Dismiss”.
You can inspect the data of a node by either double-clicking on it, or right-clicking and then choosing “Inspect”. A window opens displaying all node labels and parameters. The labels are given in the upper part and the parameters in the lower part. Here you read more about the parameter and label meanings.

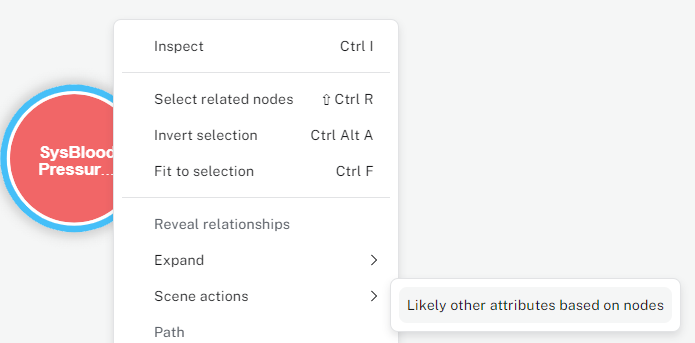
When right-clicking on one or multiple nodes, you can add edges and/or neighboring nodes:
- Add interconnecting edges by clicking on “Reveal relationships”
- Only possible when you selected multiple nodes that share at least one edge
- Add neighboring nodes with
- “Expand” to add edges based on their type
- “Scene actions”->”Likely other attributes based on nodes” to add top 5 edges with highest summed conditional prevalence

Interacting with Edges
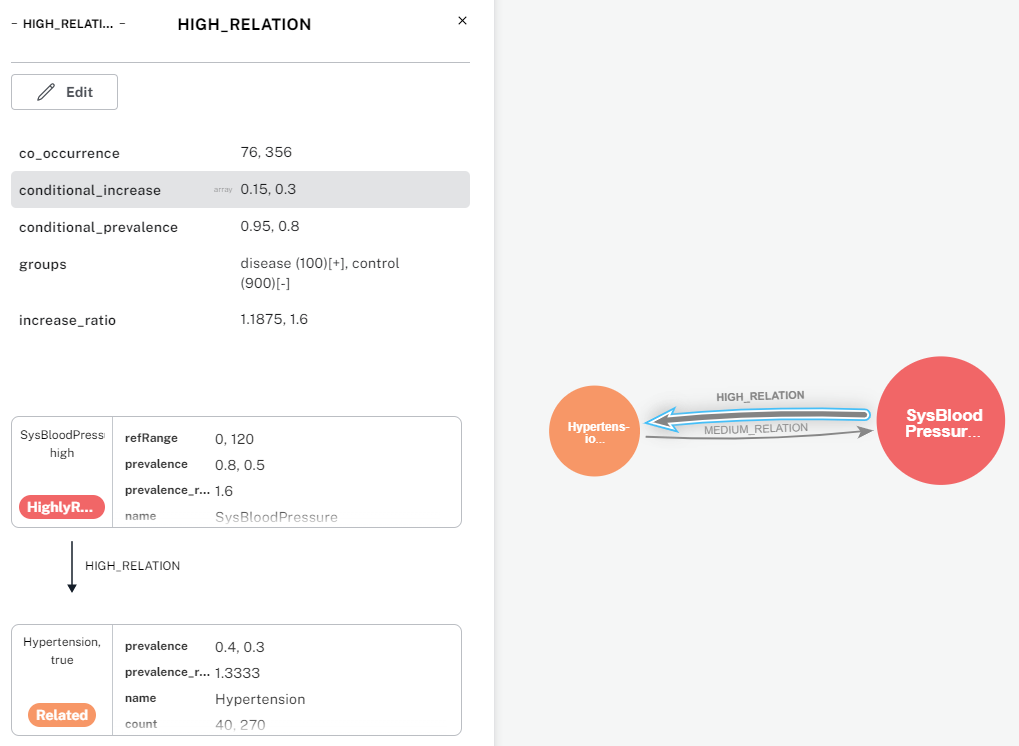
Edges are depicted as arrows with their type displayed directly above them. Same as nodes, you can select them via left-click or select multiple edges with Ctrl and left-click. You can dismiss one or multiple edges from the visualization by right-click and “Dismiss”.
You can inspect the data of the edge by double-clicking or right-click and “Inspect”, a new window opens. The edge type is displayed on top of the window. In the middle, the edge parameters are shown. Explanation of edge type and parameters can be accessed here. In the lower part of the window, the source and target node data are displayed and can be expanded.
